There are a few different ways to sync visuals to music:
- Manual – live controlling visuals with keyboard or midi controls.
- Sequencing – pre-analyzing the music and scripting an animation as a list of timecoded events.
- Midi Input – if you have access to the music’s midi data, this can be a great way to drive visuals.
- Audio Reactive – code driven visuals that automatically adapt to a live audio input.
Here I want to talk about the last method. This can be useful for “Hands Free VJing”, allowing you to sit back and have the visuals automatically sync, or in a video game where you want some part of the visuals to react to the soundtrack.
The demos below work in Chrome using Three.js and the Web Audio API, but the same principals apply if you are using Processing, OpenFrameworks or some other framework.
Audio Analysis
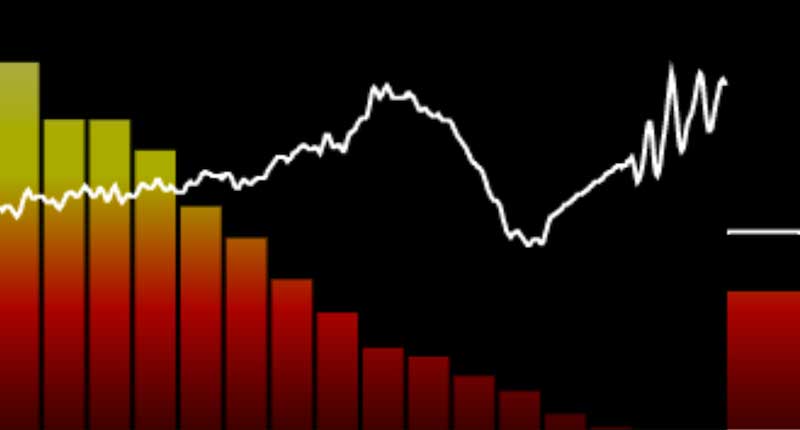
To sync to an audio input, we need to analyse the audio stream in realtime. There are 4 main pieces of data we can extract:
- Volume – the thicker bar on the right hand side
- Waveform – the jagged white line
- Levels – the bar chart of frequency amplitudes, from bass on the left to treble on the right.
- Beat Detection – the volume bar flashes white when a beat is detected. The white line above the volume bar indicates the beat threshold.
To see what these look like, view the Audio Analysis Demo. Drag and drop an MP3 file to play it, or switch to the mic input with the control panel at right.
Volume
The volume is the current global amplitude or loudness of the track. Volume data can be used raw or eased over time to give a smoother value:
smoothedVolume += (volume - smoothedVolume) * 0.1;
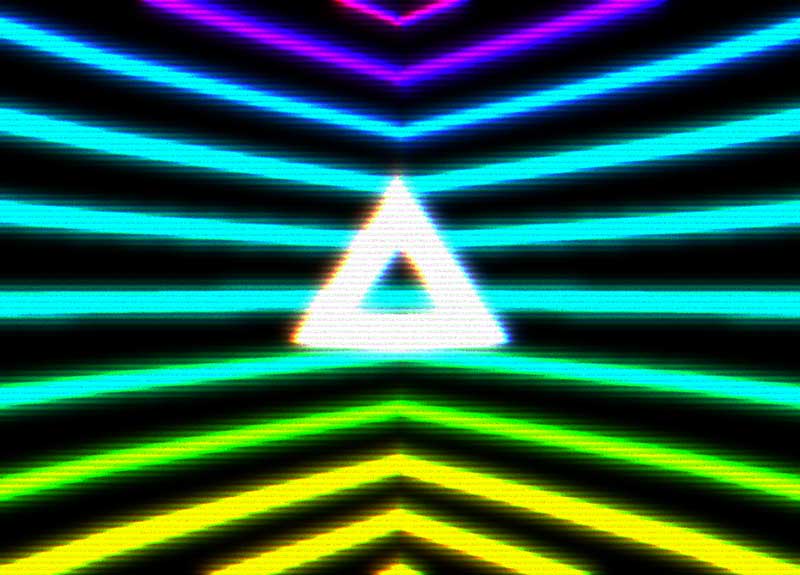
Simple volume tracking can be enough to give a nice synced feel. In the Paradolia demo, the volume is used to determine the brightness of the lights in the scene. Beat detection is also used to trigger the material textures switching out.
Waveform
The waveform is the shape of the sound wave as it flies through the air and hits your ear. With the Web Audio API, use this call to get the waveform as an array of numbers between 0 and 256, where 128 indicates silence:
analyser.getByteTimeDomainData(timeByteData);
The Loop Waveform Visualizer draws the waveform data into circles that expand from the middle of the screen. The volume is also used to give a little bounce on the height of the waveform.
Levels
The levels are an array of amplitudes for each frequency range. They can be visualized as a bar chart or a 1980’s graphic equalizer. Using the WebAudio API this call will get the levels as an array of numbers between 0 to 256, where 0 indicates silence.
analyser.getByteFrequencyData(freqByteData);
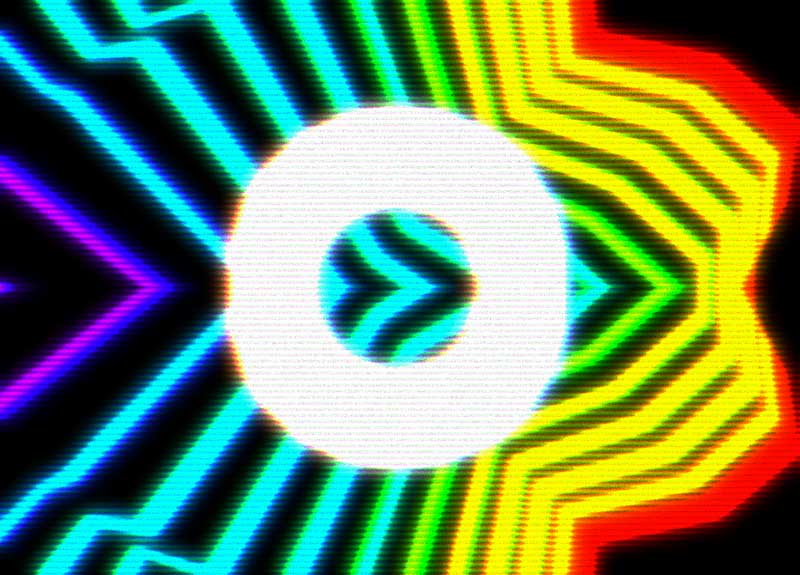
In the ÜberViz demo the levels data sets the thickness of the colored strips. The smoothed volume is used to determine the size of the central white shape. The time period of the stripes movement is set to the BPM of the song. Beat detection is used to transition the camera angle. On each transition I use the Bad TV shader to do a little warping (thanks to @active_theory for the suggestion).
Beat Detection
Reliable beat detection is hard. An audio waveform is a complex shape formed by multiple sounds overlapping, so it can be hard to pick out the beat. A beat can be defined as a “brutal variation in sound energy“, meaning a beat is when the volume goes up quickly in relation to the previous value. You can do beat detection on the global volume, or by focussing on specific frequencies (e.g. to separate the bass drum from the hi-hats).
In the Audio Analysis demo we use a Simple Beat Detection Algorithm with the following logic:
- Track a threshold volume level.
- If the current volume exceeds the threshold then you have a beat. Set the new threshold to the current volume.
- Reduce the threshold over time, using the Decay Rate.
- Wait for the Hold Time before detecting for the next beat. This can help reduce false positives.
In the demo, you can play with the ‘Beat Hold’ and ‘Beat Decay’ values to try to lock onto certain beats. This type of beat detection is good for finding less frequent ‘transition points’, depending on the delay and decay values used.
Beat detection results are heavily dependent on the track you choose. To get good results you want a track with a high dynamic range (from loud to quiet) and a simple structure. I find that Dubstep in particular is hard to beat detect, since it is typically uses lots of compression (making the whole song equally loud) and has complex drum breaks.
For professional live VJing or video music production, it’s often best to combine automatic audio-reactivity with live ‘knob twiddling’ or sequencing to produce the most interesting visuals.
Happy Visualizing!
 Latest Tweets